
|
Size: 393
Comment:
|
← Revision 4 as of 2013-05-01 04:35:24 ⇥
Size: 399
Comment: converted to 1.6 markup
|
| Deletions are marked like this. | Additions are marked like this. |
| Line 4: | Line 4: |
| The color table goes from -1500, 1500 Guass with positive fields white. The data were observed at 2012:05:09_10:00:00 TAI. | |
| Line 6: | Line 5: |
| The data were observed at 2012:05:09_10:00:00 TAI. | |
| Line 7: | Line 7: |
| [http://sun.stanford.edu/~todd/jsoc-wiki/Mag.20120509_1000.png] | The color table goes from -1500, 1500 Guass with positive fields white. [[http://sun.stanford.edu/~todd/jsoc-wiki/Mag.20120509_1000.png]] |
| Line 10: | Line 12: |
| Return to ["HARPDataSeries"] | Return to [[HARPDataSeries]] |
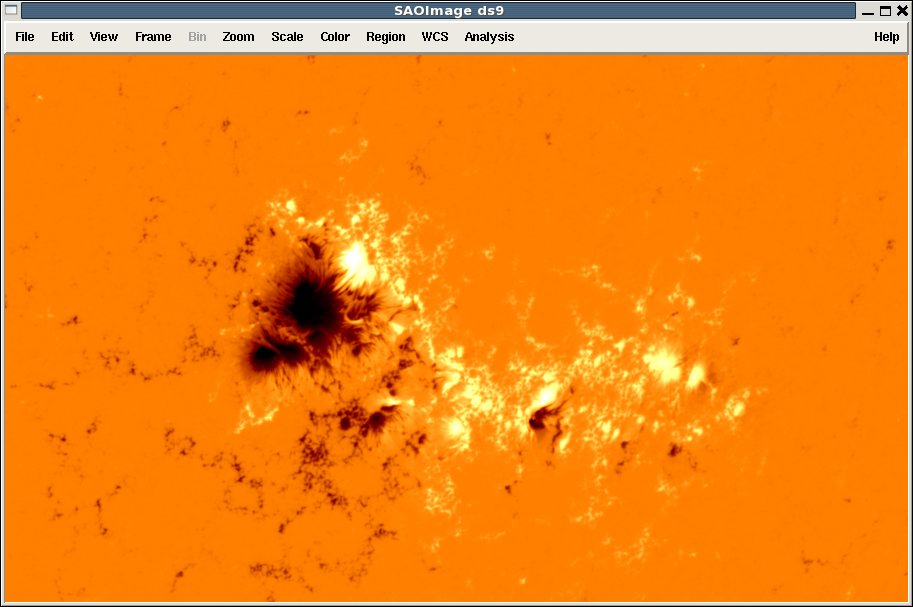
Cut-out of Magnetogram for HARP 1638
This cutout shows the line-of-sight magnetic field from hmi.M_720s in approximately the same place as the bitmap.
The data were observed at 2012:05:09_10:00:00 TAI.
The color table goes from -1500, 1500 Guass with positive fields white.
http://sun.stanford.edu/~todd/jsoc-wiki/Mag.20120509_1000.png
Return to HARPDataSeries