
Graph of HARP Characteristics
It is easy to follow the changes of HARP characteristics during disk passage.
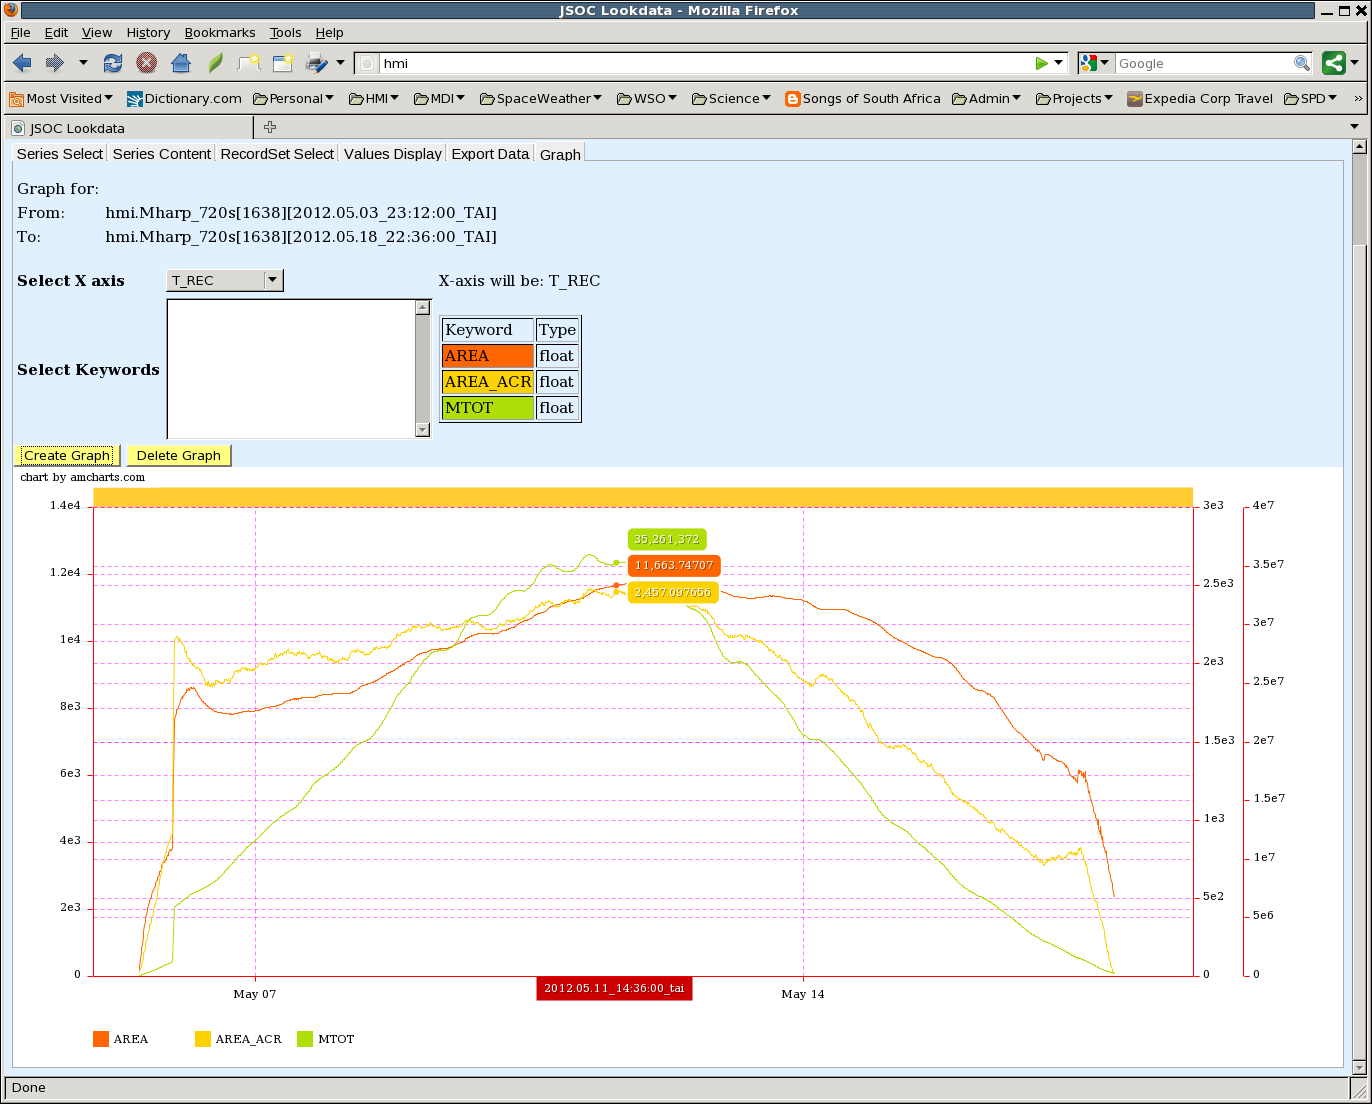
This quick graph shows how the Projected Total Area, Projected Area of the Active Pixels, and the Total Line of Sight Flux of HARP 1638 varied.
This graph of hmi.Mharp_720s keywords is readily available using the graphical tab of lookdata.
http://sun.stanford.edu/~todd/jsoc-wiki/Graph.1638.png
Return to HARPDataSeries