 Joint Science Operations Center (JSOC)
 Data archived in the JSOC can be browsed in a variety of ways:
Data archived in the JSOC can be obtained in a variety of ways:
Exportdata is intended for users who have a pretty good idea of what data is available, and which data subsets they are interested in locating and exporting from the JSOC. It is NOT useful for browsing the data archive.
Lookdata is a web based tool to browse through all the data archived in JSOC. In order to use the Lookdata webtool, one needs to do the following:
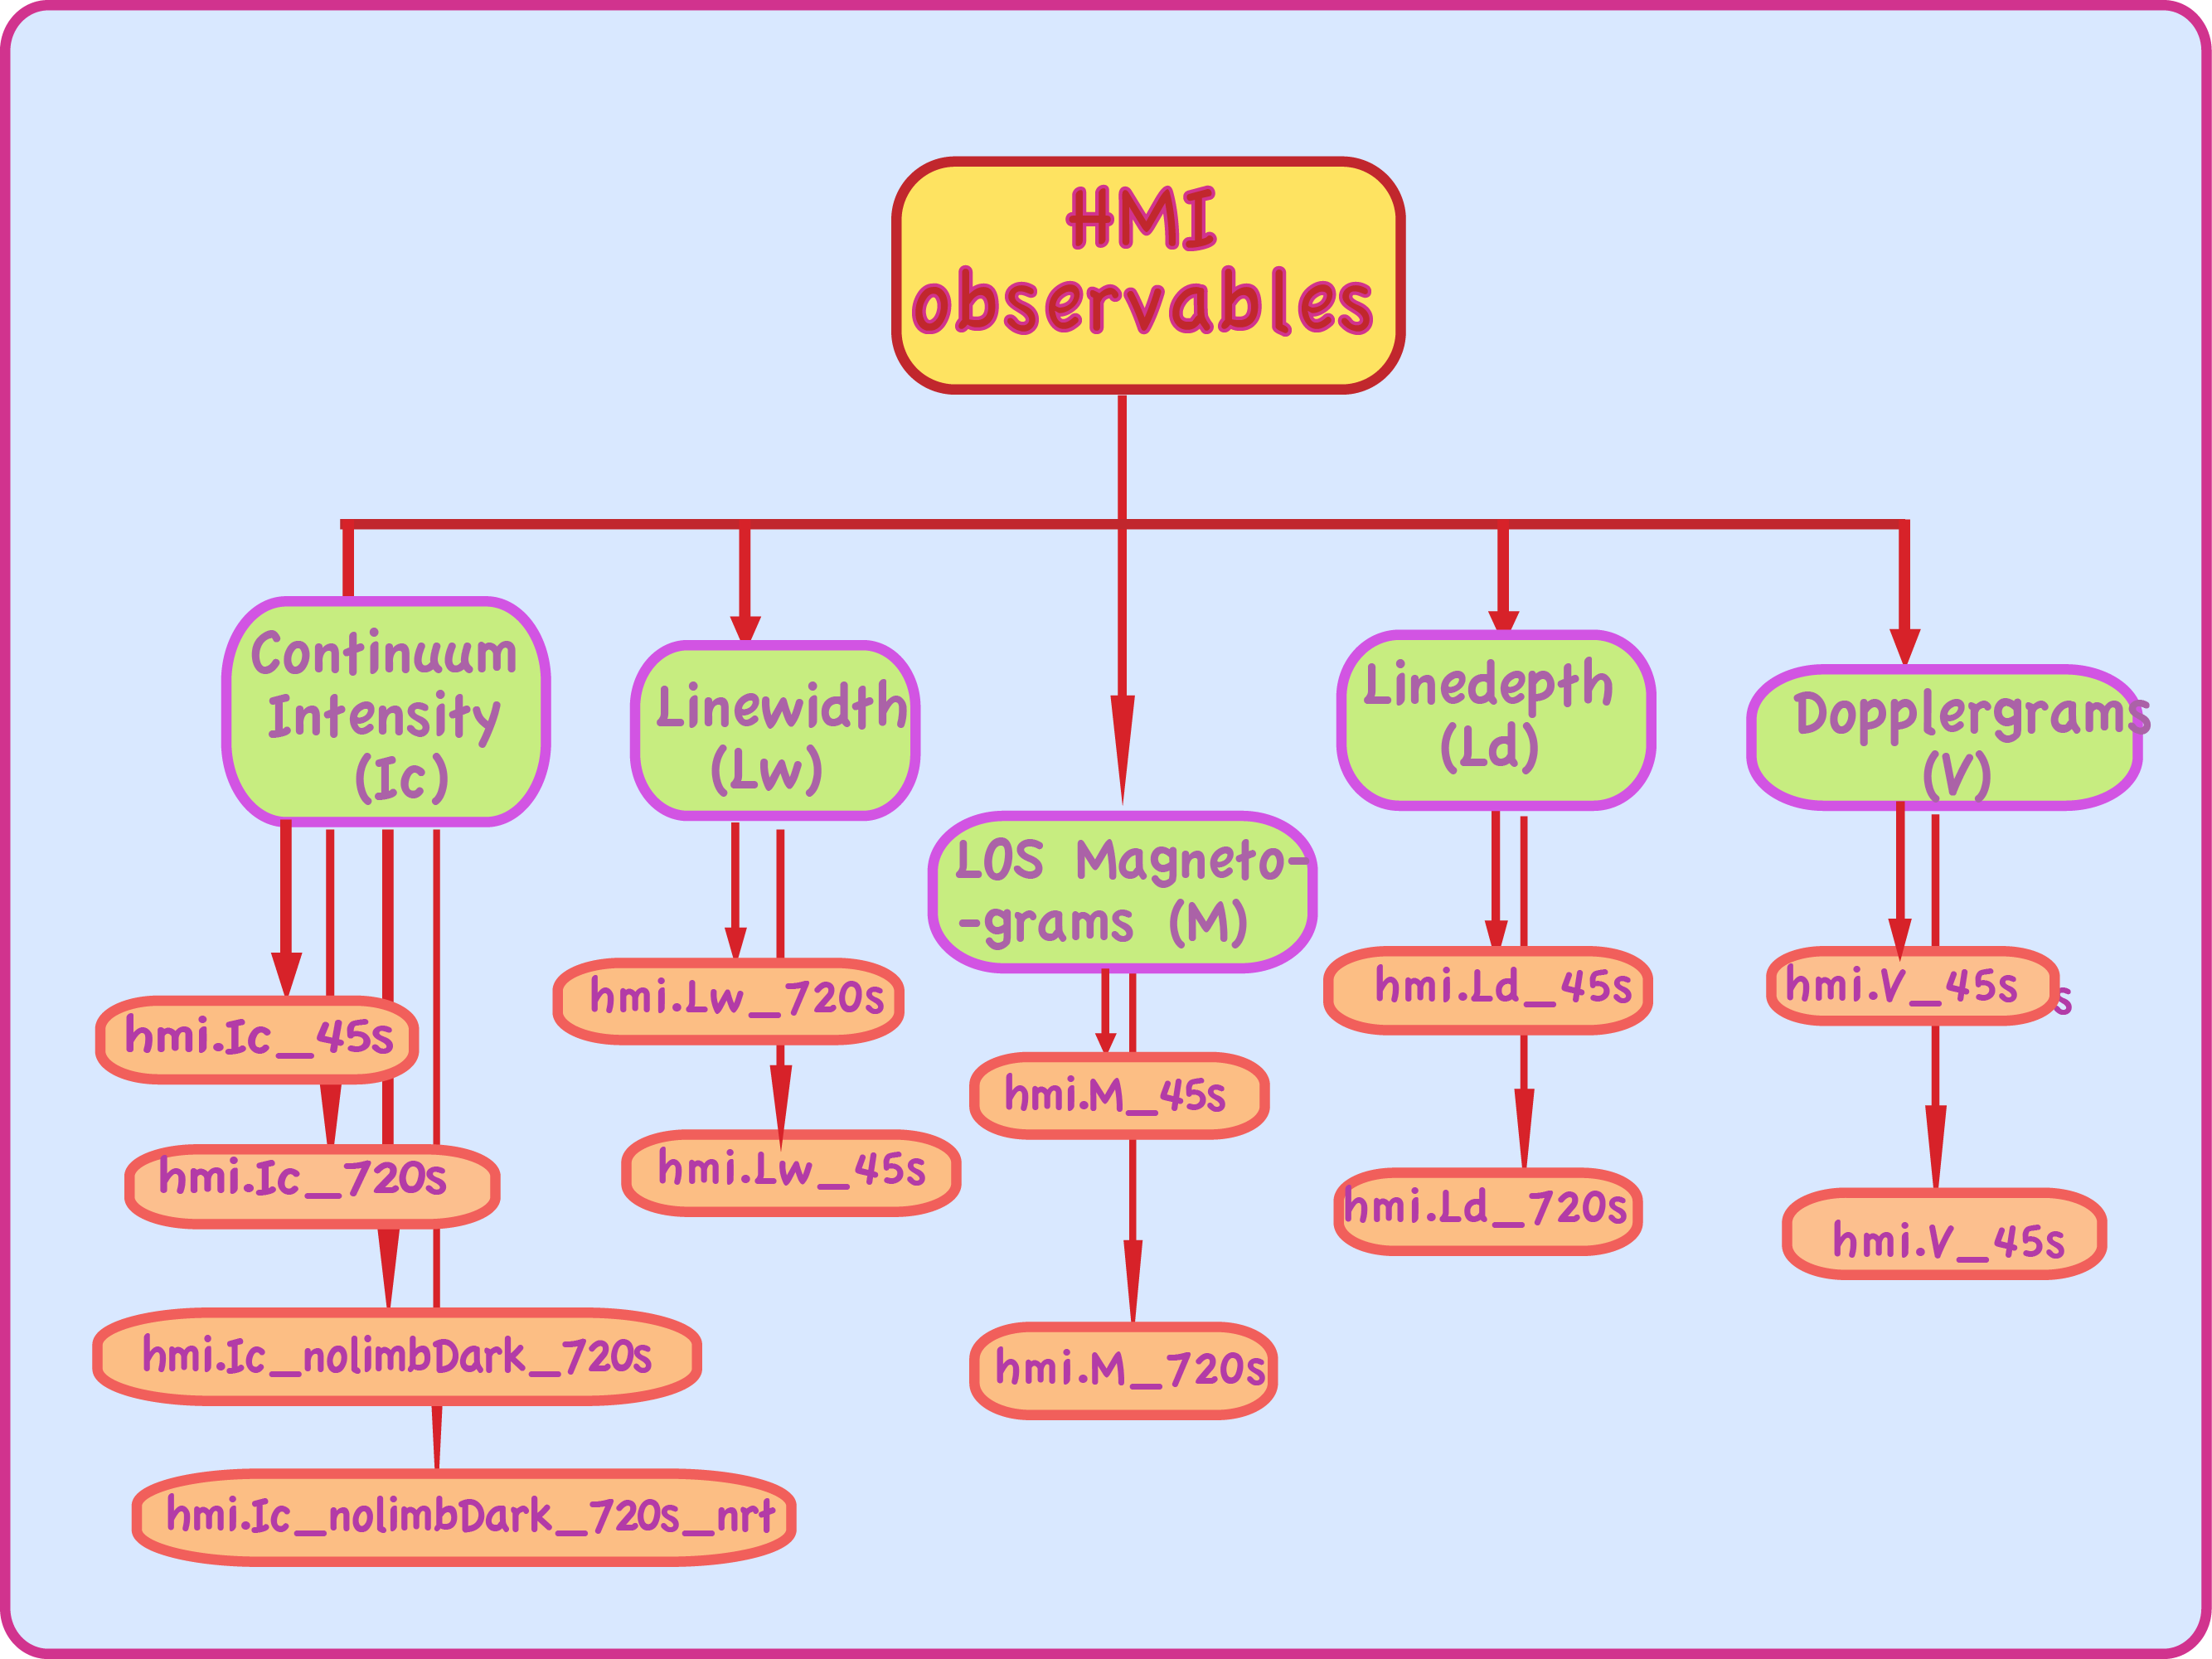
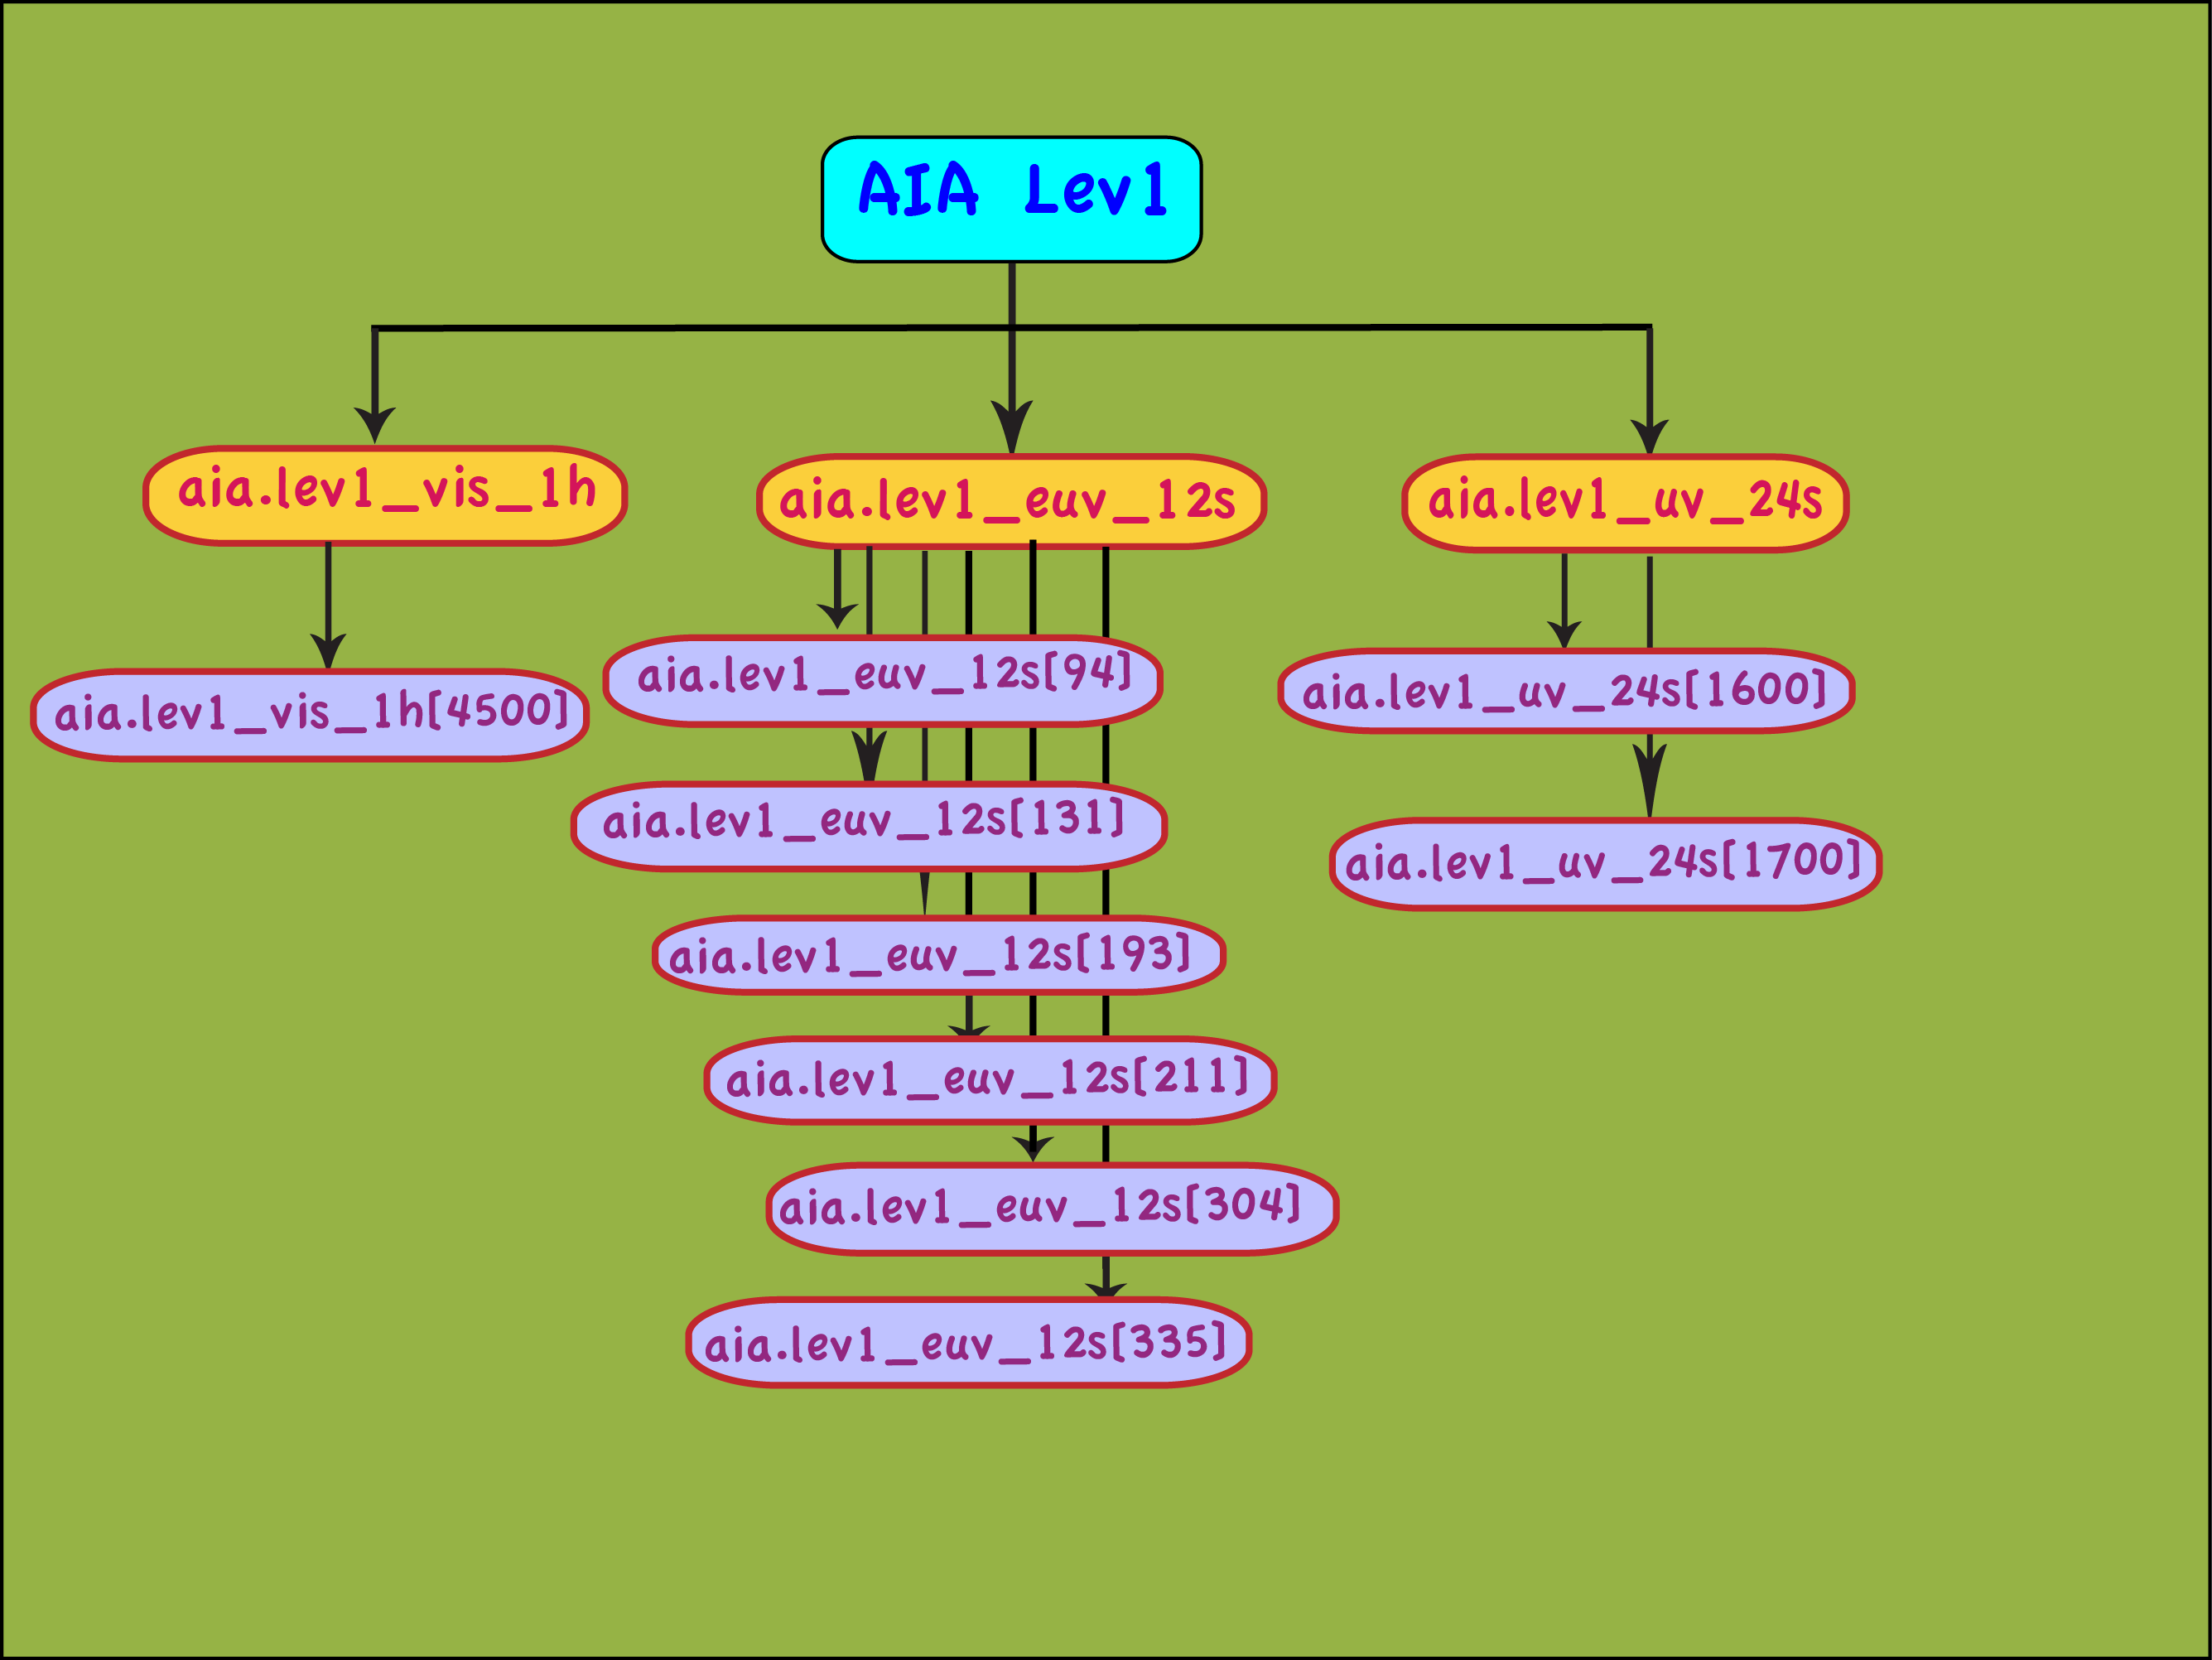
Dataseries corresponding to HMI begin with the prefix 'hmi'. AIA data begins with 'aia', MDI data begins with 'mdi', data from the Stanford Heliosiemology Archive begins with 'sha', and data from the IRIS mission begins with 'iris'.
Clicking on the yellow highlighted '?' symbol next to each field on the lookdata page will open up a pop-up help text box for that field.
As a result of Step 1, the scroll tab on the right hand side, under '2. Pick Series to use' should get populated. Scroll through the list and click on the series that you are interested in. This will populate the tab under '3. Select Records and Get Record Count' with the series you selected. It will also open a section listing 'All Keywords, Links, and Segments'
The series query in the tab under '3. Select Records and Get Record Count' needs to be further refined. This can be done by selecting a particular range of dates and times, and/or by filtering based on values of particular keywords.
Filtering by date and time is achieved by adding to the dataseries name, a date or dates enclosed in square brackets. For informational purposes, near the top of the 'RecordSet Select' tab, the dates of the earliest and most recent records in the dataseries are displayed. The following examples demonstrate this syntax (here the hmi.M_45s dataseries is used, but the syntax is generally applicable to most other dataseries):
Date and Time syntax:
-Several formats for expressing time can be used. In particular it understands a subset of ISO-8601 formats such as 2010-07-25T13:30:00 and the SDO/HMI (and SOHO/MDI) format of 2010.07.25_13:30_00. Trailing time or date parts that are omitted default to the start of the respective interval. E.g. 2010.07.25_13 corresponds to 13:00 UTC on 25 July 2010 as one would expect.
-HMI data is time tagged in TAI time, 'International Atomic Time', since they are observed on SDO using TAI time. However, for the convenience of people the times can also be expressed in UTC. But HMI data has 'nicer' time stamps when expressed in TAI.
-Note that by choice, AIA uses UTC for most user-level time stamps.
-The offset between TAI and UTC is now 34 seconds, more than half the basic HMI observing cadence of 45 seconds. Hence, you will often not get the record you expect if you use UTC to ask for HMI data.
The default for an omitted time zone specifier is UTC. Thus if you ask for hmi_test.M_45s[2010.07.25] you will get the magnetogram labeled hmi_test.M_45s[2010.07.25_00:00:45_TAI].
The full set of Prime Keys for each series are listed in lookdata both on the 'Series Content' tab and at the top of the 'RecordSet Select' tab.
After entering a query, press the 'GetRecordCount' button, and the tool will return the record count. It is necessary to press the 'GetRecordCount' button again after modifications to the query are made, to update the record count. Entering a number 'n' in the (optional) 'Record Limit' field will limit the number of records displayed, with positive numbers limiting the display to the first 'n' records and negative numbers limiting the display to the last 'n' records.
Selecting **ALL** in these boxes will return all of each of these, but to speed things up users may want to select only a subset of keywords, segments, and/or links. Users can select individual elements in these lists by holding down the COMMAND or ALT key while clicking the left mouse button, and ranges of keywords can be selected by holding down the SHIFT key while clicking. Note that the “Select Links” box will often be empty.
Clicking the 'Fetch Keyword Values for RecordSet' tab will yield in a 'Values Display' under section '7,Get Keyword and Segment Values Here' which is below the list of keywords, Links and Segments'. One needs to scroll down to see this list of keyword values in the filtered set of records see(Fig 3). Further refinement can be done by going back to the 'RecordSet Select' tab (by clicking on the tab itself), adjusting the query, and repeating Steps 3 through 6.
In addition to keyword values, the right most column of the 'Values table' typically points to the DRMS archive file/section where each of the fitsio compressed 'as-is' FITS records of your selected series currently resides. You can click on individual links preview the data.
If you wish to obtain the selected records, clicking on the Export' tab will bring up the 'Exportdata' page. See next question on 'How to use Exportdata' for more details.
Below Section 8 (i.e export data tab), is a utility that can be used to graph keyword values of filtered data versus date observed, time observed and a few other quantities of the data.
If you come to exportdata on your own, and you know which series you are looking for, you can fill in very the 1st field of the form which is "Record Set" and click 'Recount'. If you don't know what you are looking for, then we suggest you go to lookdata and browse through the published data products.
The 'Method' drop-down menu gives the user the option of choosing various export methods. For most remote users, we recommend the 'url-tar' or 'url' method. After selecting 'url', several new fields will appear.
'Protocol' should be set to 'FITS' if we desire the fits files or 'jpg' or 'mpeg' if , and “Compression” set to “compress Rice”. Also of note is the “Filename Format” field allowing users to specify the format of the filenames. For example, if it is desired that the wavelength of the image be included in the filename, then one can add {WAVELNTH} to this field.