
HARP - HMI Active Region Patches
http://sun.stanford.edu/~turmon/jsoc-wiki/track-movie-2011-feb-186-zoom.png
HARP Overview
A HARP (short for HMI Active Region Patch) is an enduring, coherent magnetic structure at the size scale of a solar active region. The primary purpose of the HARP data series is to provide the practical geometric information needed to follow an evolving region as it crosses the solar disk. A HARP is initially identified in a sequence of HMI line-of-sight magnetograms. HARPs are typically observed over several days (possibly as long as a disk passage) and tracked from one image to the next. At each time step, the rectangular HARP bounding box is defined and a BITMAP that characterizes the pixels of the HARP is recorded.
Other summary parameters, such as total flux, are also determined. A more comprehensive data series, SHARPs, is also available and is described at SpaceWeatherHARPs. The SHARPs contain 3D magnetic information, including both spatially-resolved images and keywords, whereas the HARPs contain geometric information about the HARP extent, and only those keywords which can be determined from the LOS magnetograms.
MHARPs - Line of Sight Magnetic Field HARPs
The definitive line-of-sight magnetic field HARPs are available in the data series hmi.Mharp_720s. The Mharp data series is indexed by two prime keys: an integer identifier, HARPNUM, and the time, T_REC. The HARP number is unique to the region during it's entire disk passage. A particular HARPNUM will often be linked with a NOAA Active Region (see the relevant keywords: NOAA_AR, NOAA_NUM, and NOAA_ARS). This data series provides pointers to information covering the entire disk passage for each HARP in the HMI catalog for each HARPNUM at each T_REC. Because we use 720s HMI data, some HARPs contain as many as 1500 distinct T_REC's, and some as few as three.
The HARPs are found by analyzing the active region masks in hmi.Marmask_720s (see ARmaskDataSeries). The masks are in turn derived from line-of-sight magnetograms, hmi.M_720s, and corresponding intensitygrams, hmi.Ic_noLimbDark_720s. All three of these data products are full-disk images in helioprojective-tangent coordinates (i.e., as projected on the focal plane in CCD coordinates), not remapped to a latitude-longitude system. Links to the magnetogram and the masks are provided.
HARP Bitmap - Defining the Limits of a HARP
In addition to the keywords mentioned above, the HARP data series contains a 2D data segment, the BITMAP. Coded values in the BITMAP indicate exactly which pixels within the rectangular bounding box are part of the HARP at the time T_REC. The BITMAP is a rectangle with the size of the bounding box for the full-disk images referred to above, typically several hundred pixels in each dimension. The bounding box is larger than the HARP because it is sized to enclose the largest heliographic extent of the HARP during its entire disk passage.
The CCD pixel of the lower left corner of the bounding box is given in CRPIX1 and CRPIX2.
The size of the box in pixels is given in CRSIZE1 and CRSIZE2.
Note that the HMI fits images are rotated by the angle CROTA2 (about 180 degrees).
- Other keywords provide information in heliographic coordinates.
The observations can be found by following the included links to associated line-of-sight magnetograms.
For diagnostic or summary purposes plots of individual keywords, such as integrated flux or size of the HARP, are also useful. These can be made quickly and easily using the GRAPH capability of the JSOC lookdata program. See Example 2 below.
HARP Quicklook Movies
Each month, quicklook movies are generated for the definitive HARP data series. A movie description gives more details about the layout of the movies.
Idioms for Finding HARPs
HARPs have two keywords linking them to NOAA Active Region numbers. The "best match" NOAA-AR to a given HARP is given by the integer keyword NOAA_AR. However, some HARPs contain several NOAA-ARs. So the most reliable way to look for a HARP containing a given NOAA-AR is to match against the string keyword NOAA_ARS, using the tilde or regular-expression operator. NOAA_ARS is a comma-separated list of all NOAA-ARs matching a given HARP.
If you know one time at which the NOAA-AR was active, you can use a query like:
% show_info -q 'ds=hmi.Mharp_720s[][2012.07.12_TAI][? NOAA_ARS ~ "11521" ?]' key=HARPNUM
This says to find the HARPNUM keyword of any HARP on 2012 July 12 (midnight) that matched NOAA-AR 11521. Note that the number of the NOAA AR is given as a quoted string, not a bare integer.
This is the command-line query. For detailed instructions on how to run the same query from within the lookdata web interface http://jsoc.stanford.edu/ajax/lookdata.html, see Example 6 in the record set tutorial http://jsoc2.stanford.edu/ajax/RecordSetHelp.html. The key trick here is inserting the [? ... ?] query string into the relevant field in the lookdata interface.
Sometimes you want a list of all HARPs active during a certain date range. There are a lot of such HARPs, so querying across the range of times will return thousands of HARPNUM and T_REC combinations. Let the database work for you! Get just one match per harp by restricting T_REC to match the first (or last) HARP appearance, like this:
% show_info 'ds=hmi.Mharp_720s[][2012.11.01_TAI/30d][? T_FRST1=T_REC ?]' key=HARPNUM,T_REC
This returns a list of only the 50 or so HARPs that appeared in November. It is best to match T_REC against either T_FRST1 or T_LAST1. You can again use the idea in Example 6 of the record set tutorial to run this query from the lookdata interface.
You can combine these two ideas to get a useful summary of the HARP matching a given NOAA AR, even if you don't know the exact time of the NOAA AR:
% show_info 'ds=hmi.Mharp_720s[][2012.11.01_TAI/30d][? NOAA_ARS ~ "11625" AND T_FRST1=T_REC ?]' key=HARPNUM,T_REC,T_LAST1,NOAA_ARS
HARPNUM T_REC T_LAST1 NOAA_ARS
2245 2012.11.26_21:24:00_TAI 2012.12.10_00:24:00_TAI 11623,11625
This tells you HARP 2245 lasted from 2012.11.26 through 2012.12.10, and matched NOAA AR 11623 as well as AR 11625.
Other Definitive HARP Data Series
hmi.ME_720s_fd10_HARP and hmi.ME_720s_e15w1332_HARP
HARPs are also used in the creation other data series when computation of the full disk observables is prohibitive. Currently inverted vector field data are available for selected times in hmi.ME_720s_fd10_HARP and hmi.ME_720s_e15w1332_HARP. The names are a little different because the format is different; these data sets are 4096**2 images like their namesake full disk counterparts, but at each time step only the data within all of the identified HARPs has been determined. Other data sets with disambiguated vector magnetic field data will follow.
Near Real Time HARP Data Series
hmi.Mharp_720s_nrt and hmi.ME_720s_fd10_HARP_nrt.
Near real time HARP information is most useful for space weather forecasting. The need for rapid processing means that some convenient features of the definitive HARPs cannot be realized because the future of regions is not known and we cannot afford to go back in time to adjust previous times step. For example, the heliographic size of the HARP will change as it evolves; HARPs representing multiple emergence sites may merge; ancillary information, such as NOAA AR numbers, may not be known; and data before the first emergence of flux will not be included. The numbering of HARPs and HARP_nrt's will differ. Nevertheless, since we cannot afford to reprocess much of the full disk vector field data, concentrating only on the interesting active regions allows us to maintain a rapid cadence.
The Mharp data are generally available shortly after the data are collected and look much like the definitive HARPs, except that when regions merge there will be discontinuities in some summary quantities. A movie of recent Mharps can be found at Latest MHarp MP4 and the Daily NRT Movie Archive.
The Milne-Eddington inversion data (and later the disambiguated vector B data) take longer to produce and currently lag behind. These data sets are currently like their partially filled-in full-disk counterparts. Space-weather HARPs will be computed from the regularly disambiguated data as soon as it becomes available.
Methodology
Once localized sites that are magnetically active have been found (i.e., building on the full-disk active region masks, see VectorDataReference) the HARP identification problem consists of two pieces: spatially grouping magnetic activity into objects on the scale of active regions, and tracking these objects from image to image. The grouping problem is harder, because flux emergence can cause formerly isolated ARs to merge. This means that a given HARP cannot be declared complete until it has disappeared from view or rotated off the visible disk. Consequently, final construction of the HARPs are delayed by about a month.
It is important to track HARPs up to the limb, so that all the history of the HARP can be taken in to account in making grouping decisions. Consequently, the grouping criterion takes the spherical geometry into account.
We expect it will be useful to have easy access to the precursors and successors of the HARP. So, we extrapolate the area containing the HARP backwards in time from where it was first detected, and forward from the time where it vanished, two days in each direction. (Or less, if the entire region would rotate off-disk in this time.) This has the effect of expanding the range of T_REC associated with each HARP.
Note that during padding intervals, all keywords that depend on the actual presence of field will have MISSING values, e.g. NPIX, the number of active pixels, and the flux-weighted centroids. The same pattern of missing values will occur at rare times for faint HARPs that briefly fall below the threshold during some part of their lifetime.
The HARP identification component consists of two parts, a grouping/tracking component, implemented in Matlab, and a data ingestion component, implemented as a JSOC module.
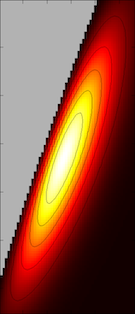
HARP Feature Scale
The following images show how the convolution kernel used for spatial grouping of active regions compares to a small active region at disk center. The units on the top two plots are HMI pixels. The bottom plot shows the convolution kernel at the same scale.
http://sun.stanford.edu/~turmon/jsoc-wiki/kernel-scale-ar-mag-small.png http://sun.stanford.edu/~turmon/jsoc-wiki/kernel-scale-ar-mask-small.png
http://sun.stanford.edu/~turmon/jsoc-wiki/ar-grouping-kernel-center-small.png |
When at the limb, the convolution kernel is foreshortened as shown at right |
http://sun.stanford.edu/~turmon/jsoc-wiki/ar-grouping-kernel-limb-small.png |
Examples
To follow a particular region, one could export the geometric information for a particular HARPNNUM.
- To find all of the HARPs on the disk at a particular time, one could search at time range.
- To track the development of a region, one could graph the value of a keyword for a region.
Example 1
February, 2011 - HARPNUM 0377 (Take me to HARP 0377)
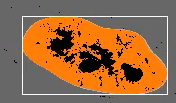
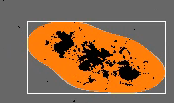
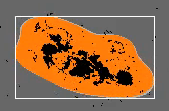
The following images are approximate data segments extracted from the large February 2011 active region, HARPNUM 0377. The corresponding HARP contains hundreds of T_REC values; we show only five. The orange blob outlines the contents of the HARP. The black pixels, most of which are inside the HARP, are all pixels declared active in the mask. Some clumps of active pixels are not large enough to constitute a HARP.
The white rectangle is not part of the data segment. It is the bounding box in pixel coordinates which contains the entire HARP, and its coordinates are part of the keywords. There is a corresponding bounding box, not shown, in Stonyhurst latitude-longitude coordinates, which is also recorded in the keywords, as MINLON0, MINLAT0, etc.
http://sun.stanford.edu/~turmon/jsoc-wiki/track-movie-2011-feb-066-zoom.png http://sun.stanford.edu/~turmon/jsoc-wiki/track-movie-2011-feb-126-zoom.png http://sun.stanford.edu/~turmon/jsoc-wiki/track-movie-2011-feb-186-zoom.png http://sun.stanford.edu/~turmon/jsoc-wiki/track-movie-2011-feb-246-zoom.png http://sun.stanford.edu/~turmon/jsoc-wiki/track-movie-2011-feb-306-zoom.png
Example 2
May 9, 2012 - HARPNUM 1638 (Take me to HARP 1638)
HARP Movie Snapshot
The image below is a snapshot showing the HARPs identified on the solar surface on May 9, 2012. Click images for details.
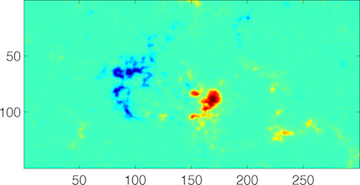
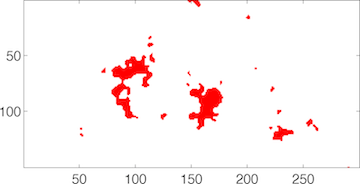
HARP Bitmap, Full-disk Mask, and Magnetogram
Bitmap, Marmask, and Magnetic Field at 2012:05:09_10:00:00 TAI - Click images for details |
||
Bitmap for HARP 1638, NOAA 11476 |
Cut-out of Full Disk Mask |
Cut out of Full Disk Magnetogram |
Graph of HARP Evolution
Graph of the changes in Area, Active Pixel Area, and Total Line of Sight Flux for HARP 1638.
Bitmap Value Table
BITMAP Pixel Values
Mask Value
Outside HARP
Inside HARP
Mar_mask
Active
2
34
2
Quiet
1
33
1
Off-limb
0
0
Some HARP Keywords
A complete description of the keywords is available in the SERIES CONTENT tab of the JSOC lookdata tool. Besides the standard HMI keywords (observation geometry, time, and WCS), we determine these keywords for HARP at each T_REC where it was observed:
Name |
unit |
Description |
MINLON |
degree |
Minimum longitude for disk transit |
MINLAT |
degree |
Minimum latitude for disk transit |
MAXLON |
degree |
Maximum longitude for disk transit |
MAXLAT |
degree |
Maximum latitude for disk transit |
OMEGA_DT |
degree/day |
Rotation rate |
NPIX |
none |
Number of pixels within the identified region |
SIZE |
mH |
Projected area of identified region on image in micro-hemisphere |
AREA |
mH |
De-projected area of identified region on sphere in micro-hemisphere |
NACR |
none |
Number of active pixels |
SIZE_ACR |
mH |
Projected area of active pixels on image in micro-hemisphere |
AREA_ACR |
mH |
De-projected area of active pixels on sphere in micro-hemisphere |
MTOT |
weber |
Sum of absolute LoS flux within the identified region |
MNET |
weber |
Net LoS flux within the identified region |
MPOS_TOT |
weber |
Absolute value of total positive LoS flux |
MNEG_TOT |
weber |
Absolute value of total negative LoS flux |
MMEAN |
gauss |
Mean of LoS flux density |
MSTDEV |
gauss |
Standard deviation of LoS flux density |
MSKEW |
none |
Skewness of LoS flux density |
MKURT |
none |
Kurtosis of LoS flux density |
MINLAT0 |
degree |
Minimum Stonyhurst latitude of pixels within the patch |
MINLON0 |
degree |
Minimum Stonyhurst longitude of pixels within the patch |
MAXLAT0 |
degree |
Maximum Stonyhurst latitude of pixels within the patch |
MAXLON0 |
degree |
Maximum Stonyhurst longitude of pixels within the patch |
FWT_LAT |
degree |
Stonyhurst latitude of flux-weighted center of active pixels |
FWT_LON |
degree |
Stonyhurst longitude of flux-weighted center of active pixels |
FWTPOS_LAT |
degree |
Stonyhurst latitude of flux-weighted center of positive flux |
FWTPOS_LON |
degree |
Stonyhurst longitude of flux-weighted center of positive flux |
FWTNEG_LAT |
degree |
Stonyhurst latitude of flux-weighted center of negative flux |
FWTNEG_LON |
degree |
Stonyhurst longitude of flux-weighted center of negative flux |
T_FRST1 |
TAI |
T_REC of first frame of this HARPNUM |
T_LAST1 |
TAI |
T_REC of last frame of this HARPNUM |
NOAA_AR |
none |
Best single matching NOAA AR number |
NOAA_ARS |
none |
Comma-separated list of all matching NOAA AR numbers |
NOAA_NUM |
none |
Number of entries in NOAA_ARS |
Future Enhancements
Tools to relate a location, event, or feature to a HARPNUM
Export tools to provide data for a single HARPNUM for a specified time range in either CCD coordinates or standard heliographic coordinates.
Note
- This data product was first published in April, 2012.
Related Data Series
ARmaskDataSeries: Full-disk activity masks.
MTARPDataSeries: Similar, but for MDI.
Back to VectorMagneticField
Back to MagneticField
Back to Lev1Doc
Back to FrontPage